Click here to download the full paper (PDF)
Authored By: Dr. Anupam Manhas, Dean Cum Principal Law, School of Legal Studies and Governance, Career Point University Hamirpur, Himachal Pradesh, Co-Authored By: Ms. Bandna Shekhar, Ph.D Scholar, Department of Law, Humanities and Arts, School of Legal Studies and Governance, Career Point University, Hamirpur, Himachal Pradesh,
Click here for Copyright Policy.
ABSTRACT:
“The researcher here did the study to find out the awareness and exercise of socio-legal rights of children among the people of the society. Therefore, a questionnaire was designed with rating-based questions and provided to all the sponsors as per selected sample size 318 and the data analysis thereto from Solan and Shimla districts of Himachal Pradesh was selected by used simple random sampling technique. Under the study of “Social Overview: Meeting Children’s Rights”, it was desirable to have mass opinion of the law experts, academicians, medical attendants, students and public in general so as to complete the study”.
Keywords: Children’s Rights, Social Rights.
I. INTRODUCTION:
A child is the most vulnerable section of the public. Hence, the welfare of the child must be considered to the maximum extent possible in any situation. As it must be the responsibility of all stakeholders vis-à-vis the government to ensure, so it is imperative to examine various legal issues which may have an impact on the interests and welfare of the child.
I.I.I OBJECTIVES OF THE STUDY:
One of the main objectives of the study is to find out the awareness among persons regarding the children’s rights. To achieve this objective is on the basis by taking opinions from selected representatives of the society who have significant participation or they have substantial exposure to the subject matter and their opinion is likely to provide sufficient insight to the research.
I.I.II HYPOTHESIS:
Most of the individuals are in favor of children’s rights
I.I.III RESEARCH METHODOLOGY:
Sampling Design: Simple random sampling technique.
Universe of study: law experts, academicians, medical attendants, students and public in general so as to complete the study.
I.II RESULTS AND INTERPRETATION:
From Table 1.1 to Table 1.17 through depicts how the respondents has responded to the questions as per their understanding and perception about the children in the society.
I.II.I GENDER:
In order to understand the if there exist any opinion variation with respect to the gender of the respondent, the respondents were asked to furnish their gender data. Table 1.1 shows the gender distribution of the sample used for this purpose. In the sample it is clear that, the sample is dominated by females as they make 69% (approx.) of the data whereas the sample contains 31% (approx.) of male respondents.
| TABLE 1.1 GENDER: | |||||
| Frequency | Percent | Valid Percent | Cumulative Percent | ||
| Valid | Male | 98 | 30.8 | 30.8 | 30.8 |
| Female | 220 | 69.2 | 69.2 | 100.0 | |
| Total | 318 | 100.0 | 100.0 | ||

I.II.II OCCUPATION:
Respondent’s occupation is found to play crucial role in developing understanding and having opinion about a subject matter as the occupation tends to affect the view point of the individual. Thus, to understand the distribution of opinion across various profession of the respondents, the respondents were asked to furnish what their occupation is. Table 1.2 shows the occupation distribution of the sample used for this purpose. The sample for this study is dominated by Students of Higher Education as they make 44% (approx.) of the data whereas the sample contains 4.4% (approx.) of Doctors/ Medical Practitioners as respondents. Also, the data covers 10.4% of general public’s opinion.
| TABLE 1.2 OCCUPATION | |||||
| Frequency | Percent | Valid Percent | Cumulative Percent | ||
| Valid | Teachers of Higher Education | 66 | 20.8 | 20.8 | 20.8 |
| Law Experts/ Advocates/ Practitioners | 66 | 20.8 | 20.8 | 41.5 | |
| Students of Higher Education | 139 | 43.7 | 43.7 | 85.2 | |
| Doctors/ Medical Practitioners | 14 | 4.4 | 4.4 | 89.6 | |
| General Public | 33 | 10.4 | 10.4 | 100.0 | |
| Total | 318 | 100.0 | 100.0 | ||

I.II.III AGE:
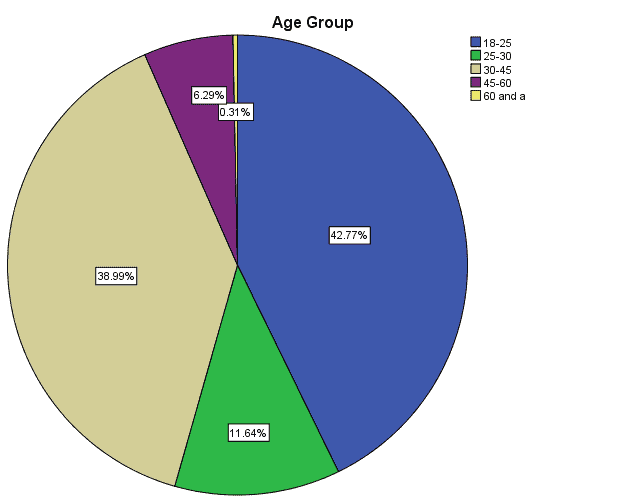
In order to study the association of respondents’ opinion across various age groups the respondents belong, the respondents were asked to furnish their age along with the answers to the questions developed in the questionnaire. Table 1.3 shows the Age-class distribution of the sample used for this purpose. Most of the respondents in the sample for this study fall in the age class of 18-25 years (42.8%) followed by 30-45 years age-class (39%). So combinedly these two age-classes cover more than 80% of the total sample.
| TABLE 1.3 AGE: | |||||
| Frequency | Percent | Valid Percent | Cumulative Percent | ||
| Valid | 18-25 | 136 | 42.8 | 42.8 | 42.8 |
| 25-30 | 37 | 11.6 | 11.6 | 54.4 | |
| 30-45 | 124 | 39.0 | 39.0 | 93.4 | |
| 45-60 | 20 | 6.3 | 6.3 | 99.7 | |
| 60 and a | 1 | .3 | .3 | 100.0 | |
| Total | 318 | 100.0 | 100.0 | ||
- Child’s Rights to minimum standards of food, shelter and clothing:
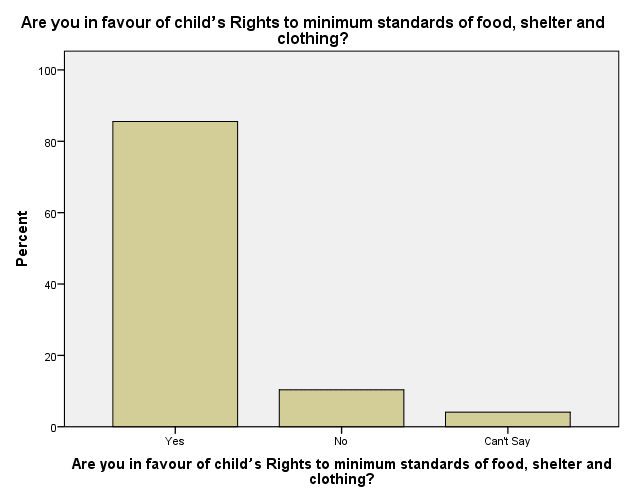
| TABLE 1.4 ARE YOU IN FAVOUR OF CHILD’S RIGHTS TO MINIMUM STANDARDS OF FOOD, SHELTER AND CLOTHING? | |||||
| Frequency | Percent | Valid Percent | Cumulative Percent | ||
| Valid | Yes | 272 | 85.5 | 85.5 | 85.5 |
| No | 33 | 10.4 | 10.4 | 95.9 | |
| Can’t Say | 13 | 4.1 | 4.1 | 100.0 | |
| Total | 318 | 100.0 | 100.0 | ||
The present data shows (Table 1.4) that majority (85.5%) of the sample respondents feel in favour of this against 10.4% of the respondents and there are 4.1% are found to say that they don’t have an opinion on this matter.
- Child to live with dignity to be treated with respect in society:
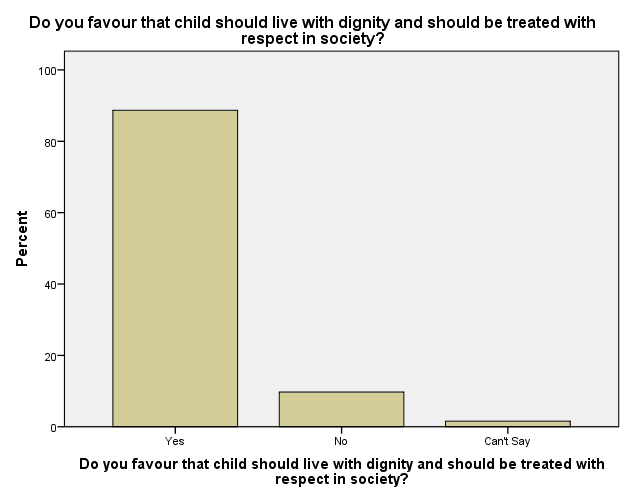
| TABLE 1.5 DO YOU FAVOUR THAT CHILD SHOULD LIVE WITH DIGNITY AND SHOULD BE TREATED WITH RESPECT IN SOCIETY? | |||||
| Frequency | Percent | Valid Percent | Cumulative Percent | ||
| Valid | Yes | 282 | 88.7 | 88.7 | 88.7 |
| No | 31 | 9.7 | 9.7 | 98.4 | |
| Can’t Say | 5 | 1.6 | 1.6 | 100.0 | |
| Total | 318 | 100.0 | 100.0 | ||
The present data shows (Table 1.5) that majority (88.7%) of the sample respondents feel in favour of this against 9.7% of the respondents and there are 1.6% are found to say that they don’t have an opinion on this matter.
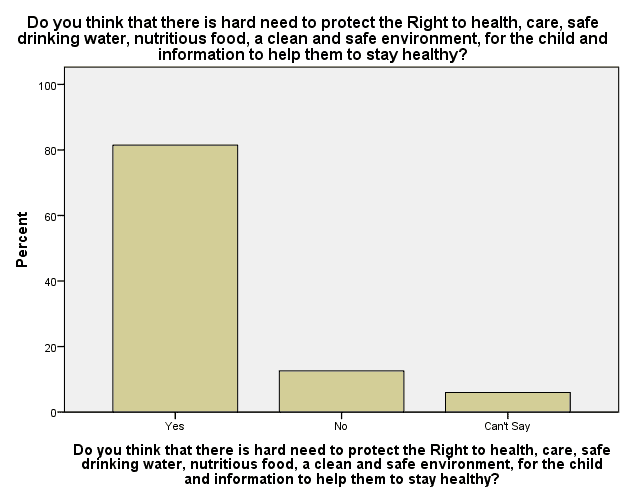
- Need to protect the Right to health, care, to safe drinking water, nutritious food, a clean and safe environment, for the child and information to help them to stay healthy:
| TABLE 1.6 DO YOU THINK THAT THERE IS HARD NEED TO PROTECT THE RIGHT TO HEALTH, CARE, SAFE DRINKING WATER, NUTRITIOUS FOOD, A CLEAN AND SAFE ENVIRONMENT, FOR THE CHILD AND INFORMATION TO HELP THEM TO STAY HEALTHY? | |||||
| Frequency | Percent | Valid Percent | Cumulative Percent | ||
| Valid | Yes | 259 | 81.4 | 81.4 | 81.4 |
| No | 40 | 12.6 | 12.6 | 94.0 | |
| Can’t Say | 19 | 6.0 | 6.0 | 100.0 | |
| Total | 318 | 100.0 | 100.0 | ||
The present data shows (Table 1.6) that majority (81.4%) of the sample respondents feel in favour of this against 12.6% of the respondents and there are 6% are found to say that they don’t have an opinion on this matter.
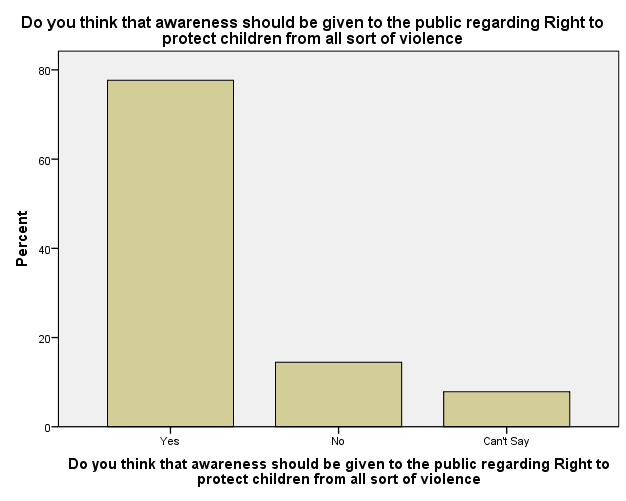
- Public awareness regarding Right to protect children from all sort of violence:
| TABLE 1.7 DO YOU THINK THAT AWARENESS SHOULD BE GIVEN TO THE PUBLIC REGARDING RIGHT TO PROTECT CHILDREN FROM ALL SORT OF VIOLENCE: | |||||
| Frequency | Percent | Valid Percent | Cumulative Percent | ||
| Valid | Yes | 247 | 77.7 | 77.7 | 77.7 |
| No | 46 | 14.5 | 14.5 | 92.1 | |
| Can’t Say | 25 | 7.9 | 7.9 | 100.0 | |
| Total | 318 | 100.0 | 100.0 | ||
The present data shows (Table 1.7) that majority (77.7%) of the sample respondents feel in favour of this against 14.5% of the respondents and there are 7.9% are found to say that they don’t have an opinion on this matter.
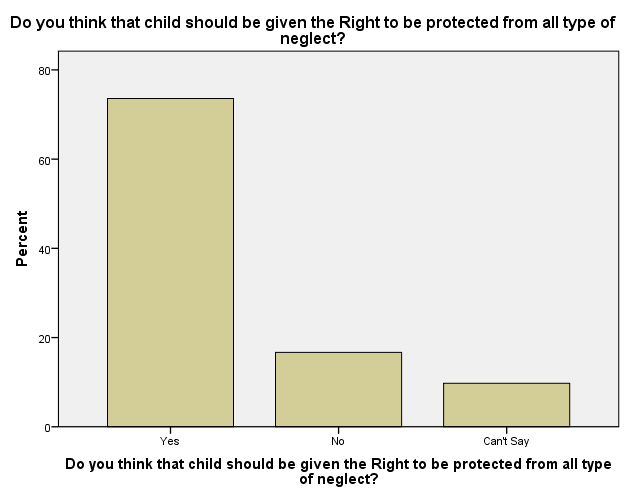
- Child’s right to be protected from all type of neglect:
| TABLE 1.8 DO YOU THINK THAT CHILD SHOULD BE GIVEN THE RIGHT TO BE PROTECTED FROM ALL TYPE OF NEGLECT? | |||||
| Frequency | Percent | Valid Percent | Cumulative Percent | ||
| Valid | Yes | 234 | 73.6 | 73.6 | 73.6 |
| No | 53 | 16.7 | 16.7 | 90.3 | |
| Can’t Say | 31 | 9.7 | 9.7 | 100.0 | |
| Total | 318 | 100.0 | 100.0 | ||
The present data (Table 1.8) shows that majority (73.6%) of the sample respondents feel in favour of this against 16.7% of the respondents and there are 9.7% are found to say that they don’t have an opinion on this matter.
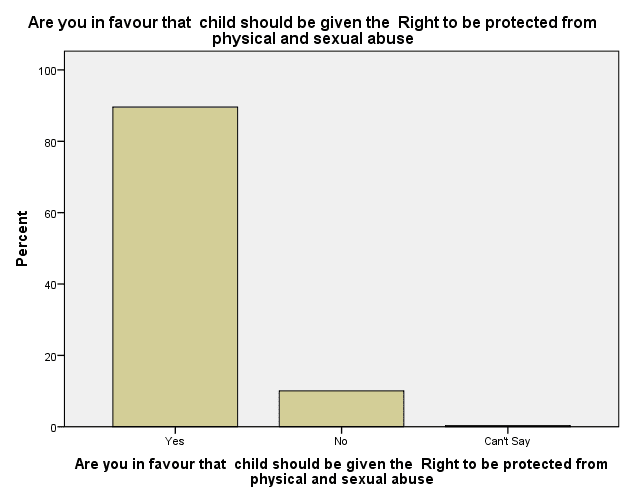
- Child’s right to be protected from physical and sexual abuse:
| TABLE 1.9 ARE YOU IN FAVOUR THAT CHILD SHOULD BE GIVEN THE RIGHT TO BE PROTECTED FROM PHYSICAL AND SEXUAL ABUSE: | |||||
| Frequency | Percent | Valid Percent | Cumulative Percent | ||
| Valid | Yes | 285 | 89.6 | 89.6 | 89.6 |
| No | 32 | 10.1 | 10.1 | 99.7 | |
| Can’t Say | 1 | .3 | .3 | 100.0 | |
| Total | 318 | 100.0 | 100.0 | ||
The present data shows (Table 1.9) that majority (89.6%) of the sample respondents feel in favour of this against 10.1% of the respondents and there are 3% are found to say that they don’t have an opinion on this matter.
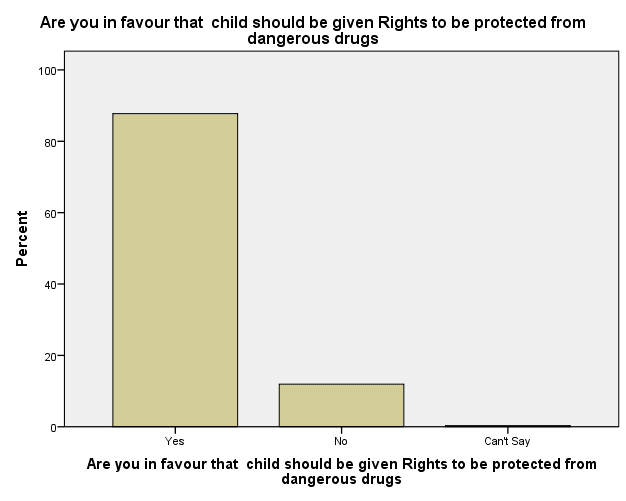
- Child’s rights to be protected from dangerous drugs:
| TABLE 1.10 ARE YOU IN FAVOUR THAT CHILD SHOULD BE GIVEN RIGHTS TO BE PROTECTED FROM DANGEROUS DRUGS: | |||||
| Frequency | Percent | Valid Percent | Cumulative Percent | ||
| Valid | Yes | 279 | 87.7 | 87.7 | 87.7 |
| No | 38 | 11.9 | 11.9 | 99.7 | |
| Can’t Say | 1 | .3 | .3 | 100.0 | |
| Total | 318 | 100.0 | 100.0 | ||
The present data shows (Table 1.10) that majority (87.7%) of the sample respondents feel in favour of this against 11.9% of the respondents and there are 3% are found to say that they don’t have an opinion on this matter.
- Child’ right to freedom of opinion:
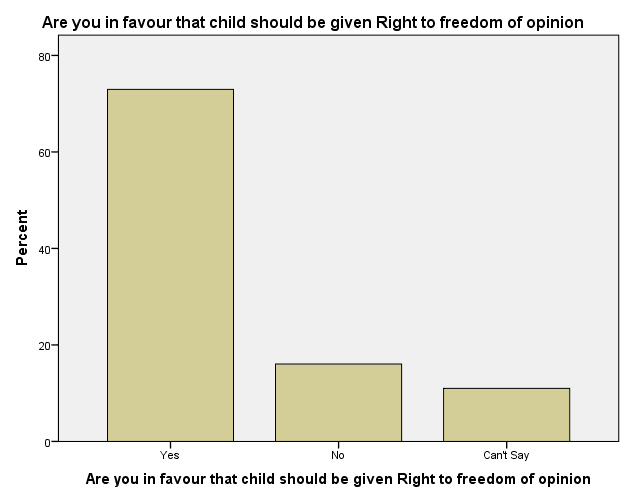
| TABLE 1.11 ARE YOU IN FAVOUR THAT CHILD SHOULD BE GIVEN RIGHT TO FREEDOM OF OPINION: | |||||
| Frequency | Percent | Valid Percent | Cumulative Percent | ||
| Valid | Yes | 232 | 73.0 | 73.0 | 73.0 |
| No | 51 | 16.0 | 16.0 | 89.0 | |
| Can’t Say | 35 | 11.0 | 11.0 | 100.0 | |
| Total | 318 | 100.0 | 100.0 | ||
The present data shows (Table 1.11) that majority (73%) of the sample respondents feel in favour of this against 16% of the respondents and there are 11% are found to say that they don’t have an opinion on this matter.
- Child’s right to participate in any decision making that involves him/her directly or indirectly:
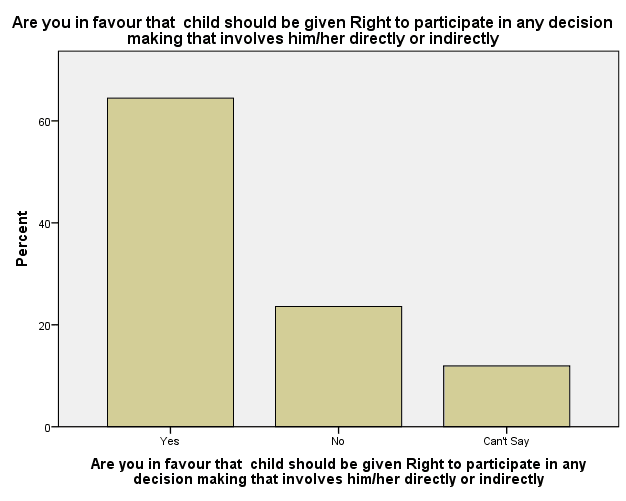
| TABLE 1.12 ARE YOU IN FAVOUR THAT CHILD SHOULD BE GIVEN RIGHT TO PARTICIPATE IN ANY DECISION MAKING THAT INVOLVES HIM/HER DIRECTLY OR INDIRECTLY: | |||||
| Frequency | Percent | Valid Percent | Cumulative Percent | ||
| Valid | Yes | 205 | 64.5 | 64.5 | 64.5 |
| No | 75 | 23.6 | 23.6 | 88.1 | |
| Can’t Say | 38 | 11.9 | 11.9 | 100.0 | |
| Total | 318 | 100.0 | 100.0 | ||
The present data shows (Table 1.12) that majority (64.5%) of the sample respondents feel in favour of this against 23.6% of the respondents and there are 11.9% are found to say that they don’t have an opinion on this matter.
- Child’s right to education:
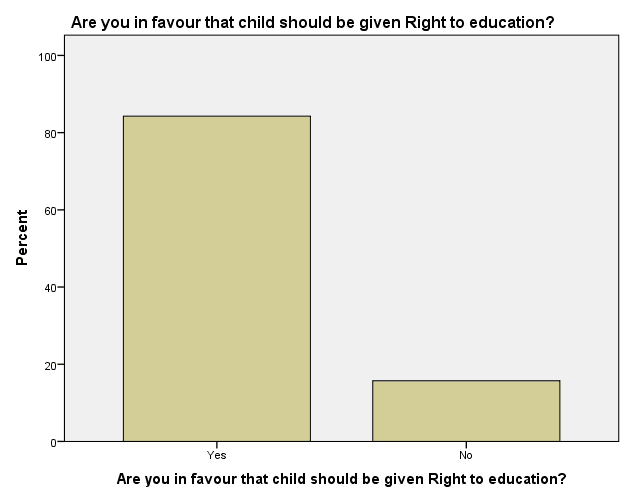
| TABLE 1.13 ARE YOU IN FAVOUR THAT CHILD SHOULD BE GIVEN RIGHT TO EDUCATION? | |||||
| Frequency | Percent | Valid Percent | Cumulative Percent | ||
| Valid | Yes | 268 | 84.3 | 84.3 | 84.3 |
| No | 50 | 15.7 | 15.7 | 100.0 | |
| Total | 318 | 100.0 | 100.0 | ||
The present data (Table 1.13) shows that majority (84.3%) of the sample respondents feel in favour of this against 15.7% of the respondents.
- Child’s right to learn:
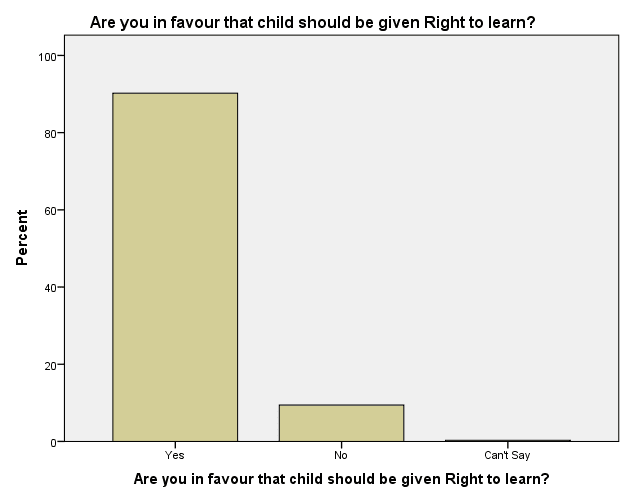
| TABLE 1.14 ARE YOU IN FAVOUR THAT CHILD SHOULD BE GIVEN RIGHT TO LEARN? | |||||
| Frequency | Percent | Valid Percent | Cumulative Percent | ||
| Valid | Yes | 287 | 90.3 | 90.3 | 90.3 |
| No | 30 | 9.4 | 9.4 | 99.7 | |
| Can’t Say | 1 | .3 | .3 | 100.0 | |
| Total | 318 | 100.0 | 100.0 | ||
The present data shows (Table 1.14) that majority (90.3%) of the sample respondents feel in favour of this against 9.4% of the respondents and there are 3% are found to say that they don’t have an opinion on this matter.
- Child’s right to relax and play:
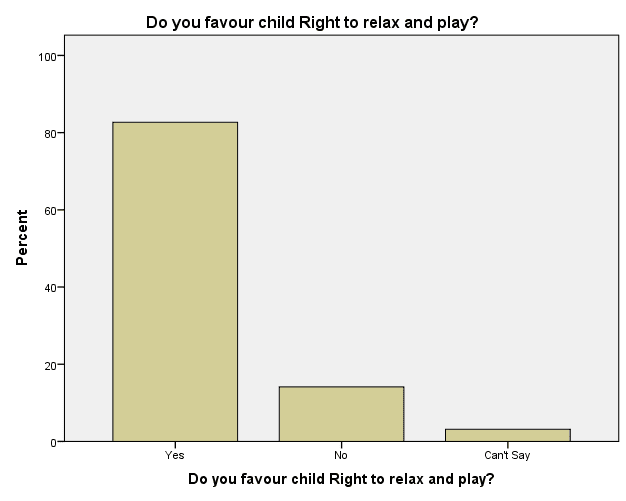
| TABLE 1.15 DO YOU FAVOUR CHILD RIGHT TO RELAX AND PLAY? | |||||
| Frequency | Percent | Valid Percent | Cumulative Percent | ||
| Valid | Yes | 263 | 82.7 | 82.7 | 82.7 |
| No | 45 | 14.2 | 14.2 | 96.9 | |
| Can’t Say | 10 | 3.1 | 3.1 | 100.0 | |
| Total | 318 | 100.0 | 100.0 | ||
The present data shows (Table 1.15) that majority (82.7%) of the sample respondents feel in favour of this against 14.2% of the respondents and there are 3.1% are found to say that they don’t have an opinion on this matter.
- Child’s rights to all forms of development-emotional, mental and physical:
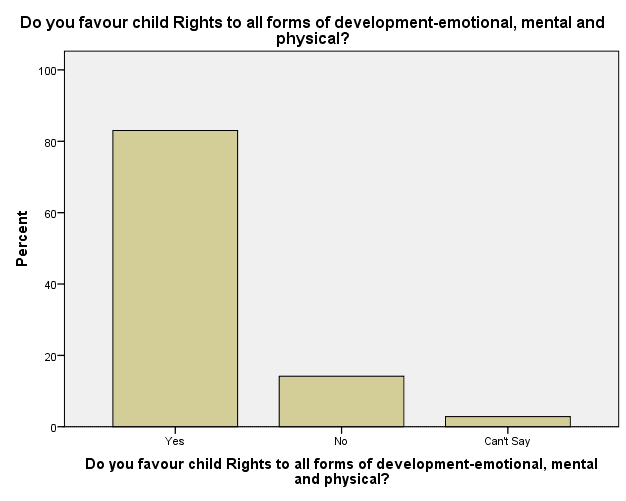
| TABLE 1.16 DO YOU FAVOUR CHILD RIGHTS TO ALL FORMS OF DEVELOPMENT-EMOTIONAL, MENTAL AND PHYSICAL? | |||||
| Frequency | Percent | Valid Percent | Cumulative Percent | ||
| Valid | Yes | 264 | 83.0 | 83.0 | 83.0 |
| No | 45 | 14.2 | 14.2 | 97.2 | |
| Can’t Say | 9 | 2.8 | 2.8 | 100.0 | |
| Total | 318 | 100.0 | 100.0 | ||
The present data shows (Table 1.16) that majority (83%) of the sample respondents feel in favour of this against 14.2% of the respondents and there are 2.8% are found to say that they don’t have an opinion on this matter.
- Government and children’s right to a name, a nationality and family ties:
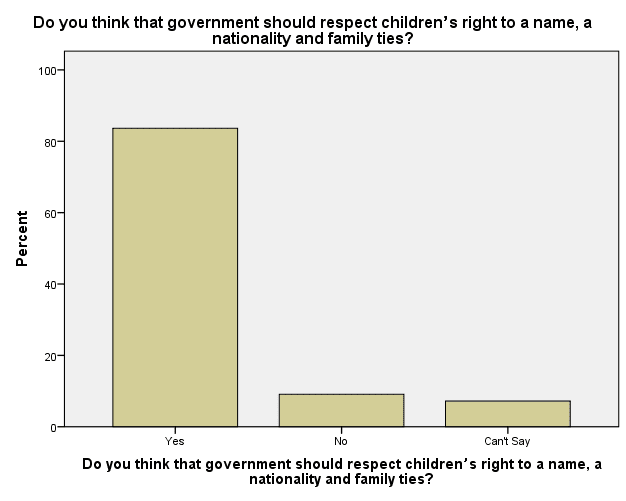
| TABLE 1.17 DO YOU THINK THAT GOVERNMENT SHOULD RESPECT CHILDREN’S RIGHT TO A NAME, A NATIONALITY AND FAMILY TIES? | |||||
| Frequency | Percent | Valid Percent | Cumulative Percent | ||
| Valid | Yes | 266 | 83.6 | 83.6 | 83.6 |
| No | 29 | 9.1 | 9.1 | 92.8 | |
| Can’t Say | 23 | 7.2 | 7.2 | 100.0 | |
| Total | 318 | 100.0 | 100.0 | ||
The present data shows that (Table 1.17) majority (83.6%) of the sample respondents feel in favour of this against 9.1% of the respondents and there are 7.2% are found to say that they don’t have an opinion on this matter.
II. CONCLUSION:
The conclusion can be drawn on the basis of the analysis discussed as above in the light of the comments subscribed by some of the respondents that majority is in favour of children’s rights, simultaneously discarding all types of discrimination based on sex, color, creed, nationality etc.
Cite this article as:
Dr. Anupam Manhas & Ms. Bandna Shekhar, “Social Overview: Meeting Children’s Rights”, Vol.4 & Issue 5, Law Audience Journal (e-ISSN: 2581-6705), Pages 149 to 170 (22nd February 2023), available at https://www.lawaudience.com/social-overview-meeting-childrens-rights/.
